
States With the Most Credit Card Debt
After a long period of deleveraging following the Great Recession, total household debt in the U.S. rose again in the second quarter of 2018, continuing its 16-quarter growth spree. As of June 2018, total household debt stood at $13.29 trillion, an $82 billion increase over the previous quarter and a $618 billion increase over the pre-recession peak that occured in the third quarter of 2008.
Wide growth in borrowing (and spending)—occurring alongside record low unemployment rates and what many consider to be the longest-running bull market in U.S. history—is generally considered to be a sign of strengthening consumer confidence.
Despite this, delinquency rates have been inching up for certain loan types—namely, auto loans and credit cards—suggesting that, at least for some Americans, the strong economy isn’t translating into improved financial stability.
Credit cards are the most common type of loan held by American households. According to the New York Fed, there are just shy of 470 million credit card accounts in the U.S., or an average of 3.7 cards per household. Credit cards have long served as a convenient way to pay for day-to-day expenses without carrying cash or checks. That same convenience, however, also makes it easy for consumers to overspend if not careful.

According to Credit Sesame, an online credit management platform, more than half of cardholders in the U.S. don’t pay their card bill off in full each month, thus accumulating interest and a growing balance. When one of these cardholders is unable to make the minimum payment on their card, it is known as a delinquency. Despite declining delinquency rates since the Great Recession across all loan types, the flow into 90+ day delinquency for credit card balances has increased 10 percent over the past two years, according to data from the New York Fed.

To better understand how credit card debt is impacting American households, researchers at Credit Sesame combined data from the New York Fed, U.S. Bureau of Labor Statistics, U.S. Census, and its own credit score survey data. Here’s what they found:
Takeaways
- At 5.7 percent growth, total credit card debt in the U.S. rose faster over the past year than any other loan type, outpacing the 3.5 percent average growth across all loans.
- The national credit card delinquency rate was 7.88 percent in Q2 2018. The most recent state-level estimates (Q4 2017) range from a high of 10.76 percent in Nevada to a low of 4.74 percent in Wisconsin.
- The average household in the U.S. held $6,568 in credit card debt. With a national median household income of $57,617, that represents a debt-to-income ratio of 11.4 percent. These figures range from a high of 15.4 percent in Florida to a low of 9.0 percent in Iowa.
- Across all U.S. states, credit card delinquency rate was not correlated with average credit card debt, median household income, or regional differences in the price of goods and services. Rather, credit card delinquency showed a positive correlation with debt as a percent of income (debt-to-income ratio). In other words, it’s not how much debt a state’s residents carried or how much they earned that predicted delinquency; but instead, it was how much debt they carried relative to their income.
- Across all U.S. states, credit card delinquency rate showed a mild positive correlation with unemployment rate. States with higher unemployment rates were more likely to have a higher percentage of credit card balances 90+ days delinquent. Additionally, delinquency rate showed a mild negative correlation with average credit score. States with high delinquency rates were more likely to have lower average credit score, which is in line with what’s understood about payment history and its impact on credit score.
Below are the 15 states with the most credit card delinquencies. Full results of the study can be found on Credit Sesame.
States with the most credit card delinquencies
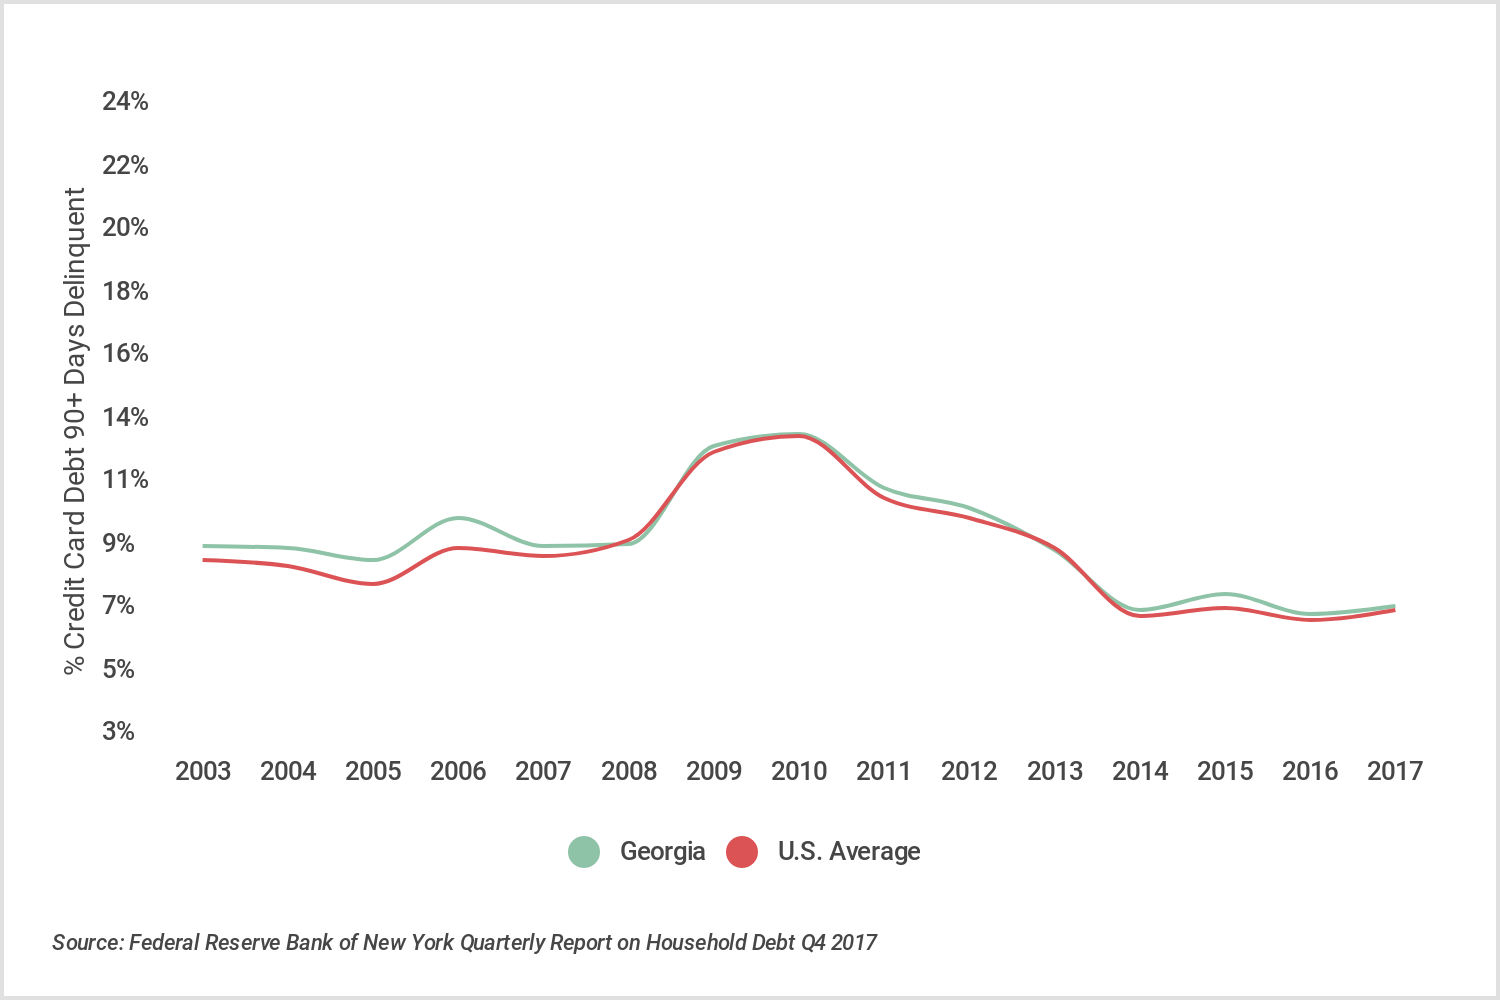
15. Georgia
- Credit card delinquency rate: 7.64%
- Household credit card debt-to-income ratio: 13.35%
- Credit card debt per household: $7,149
- Median household income: $53,559
- Median credit score: 650
- Unemployment rate: 5.0%
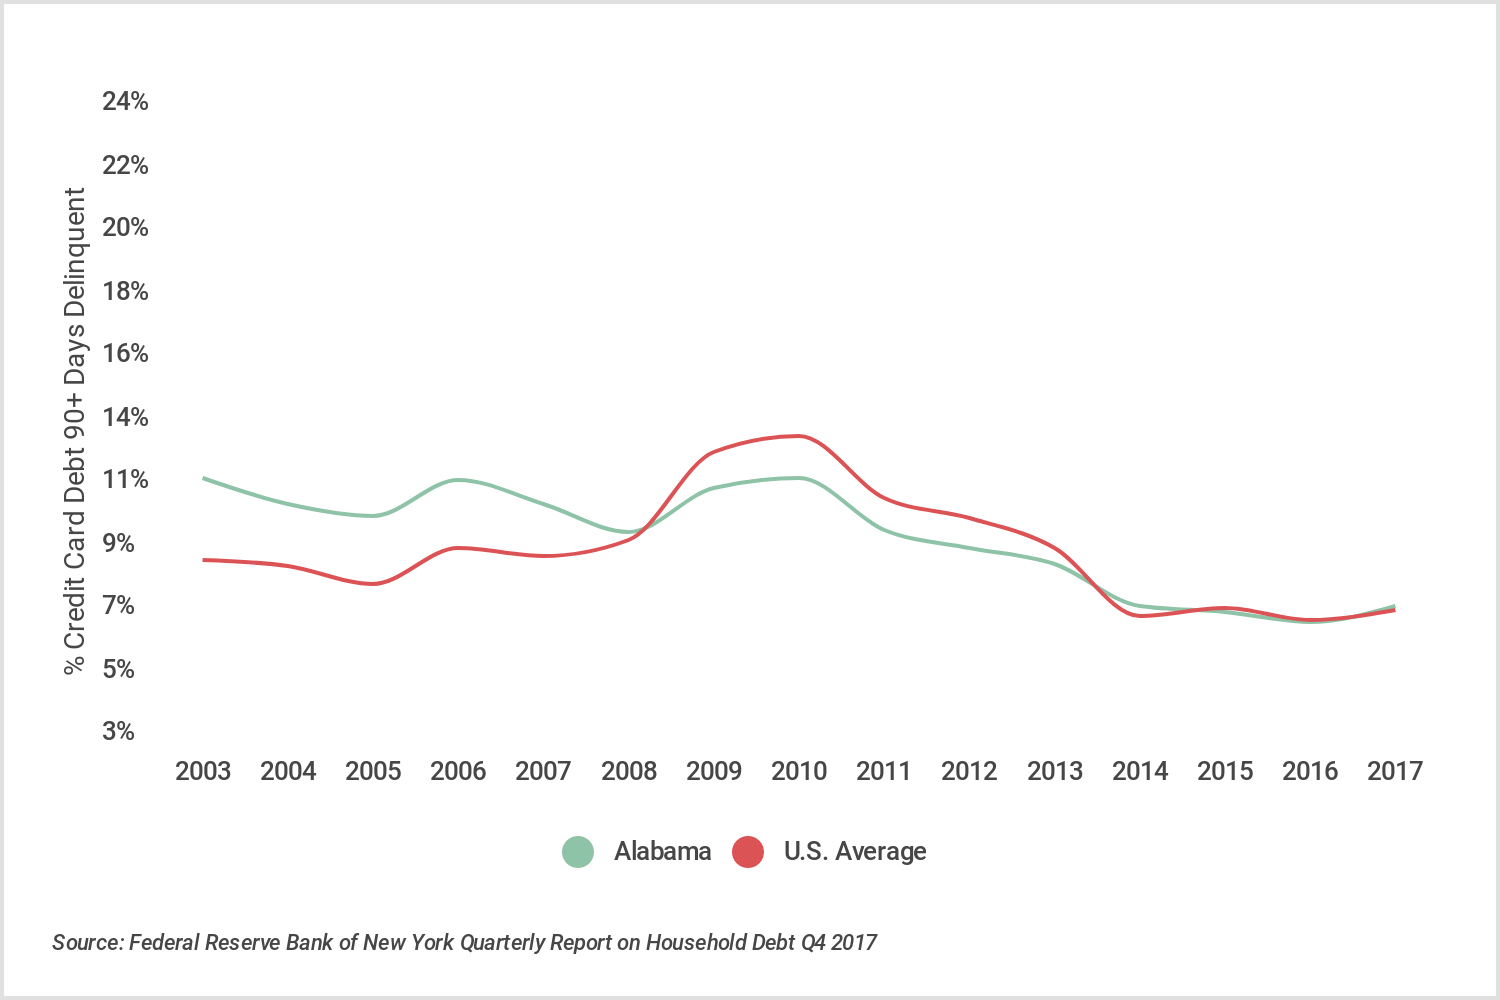
14. Alabama
- Credit card delinquency rate: 7.68%
- Household credit card debt-to-income ratio: 11.41%
- Credit card debt per household: $5,277
- Median household income: $46,257
- Median credit score: 658
- Unemployment rate: 4.9%
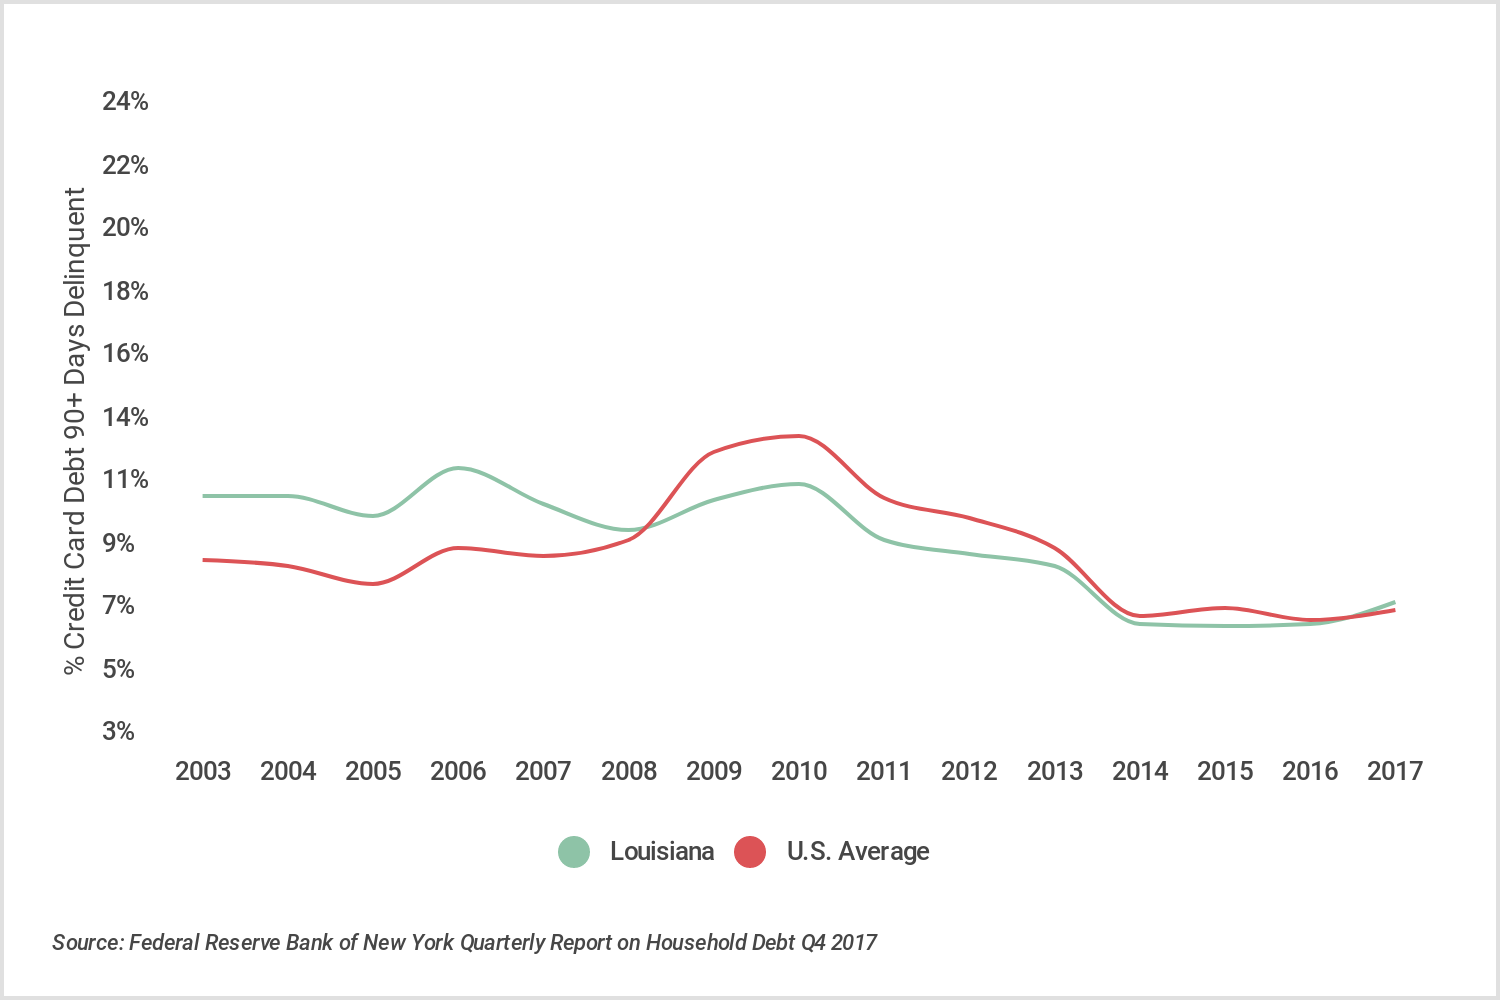
13. Louisiana
- Credit card delinquency rate: 7.78%
- Household credit card debt-to-income ratio: 12.02%
- Credit card debt per household: $5,425
- Median household income: $45,146
- Median credit score: 653
- Unemployment rate: 4.2%
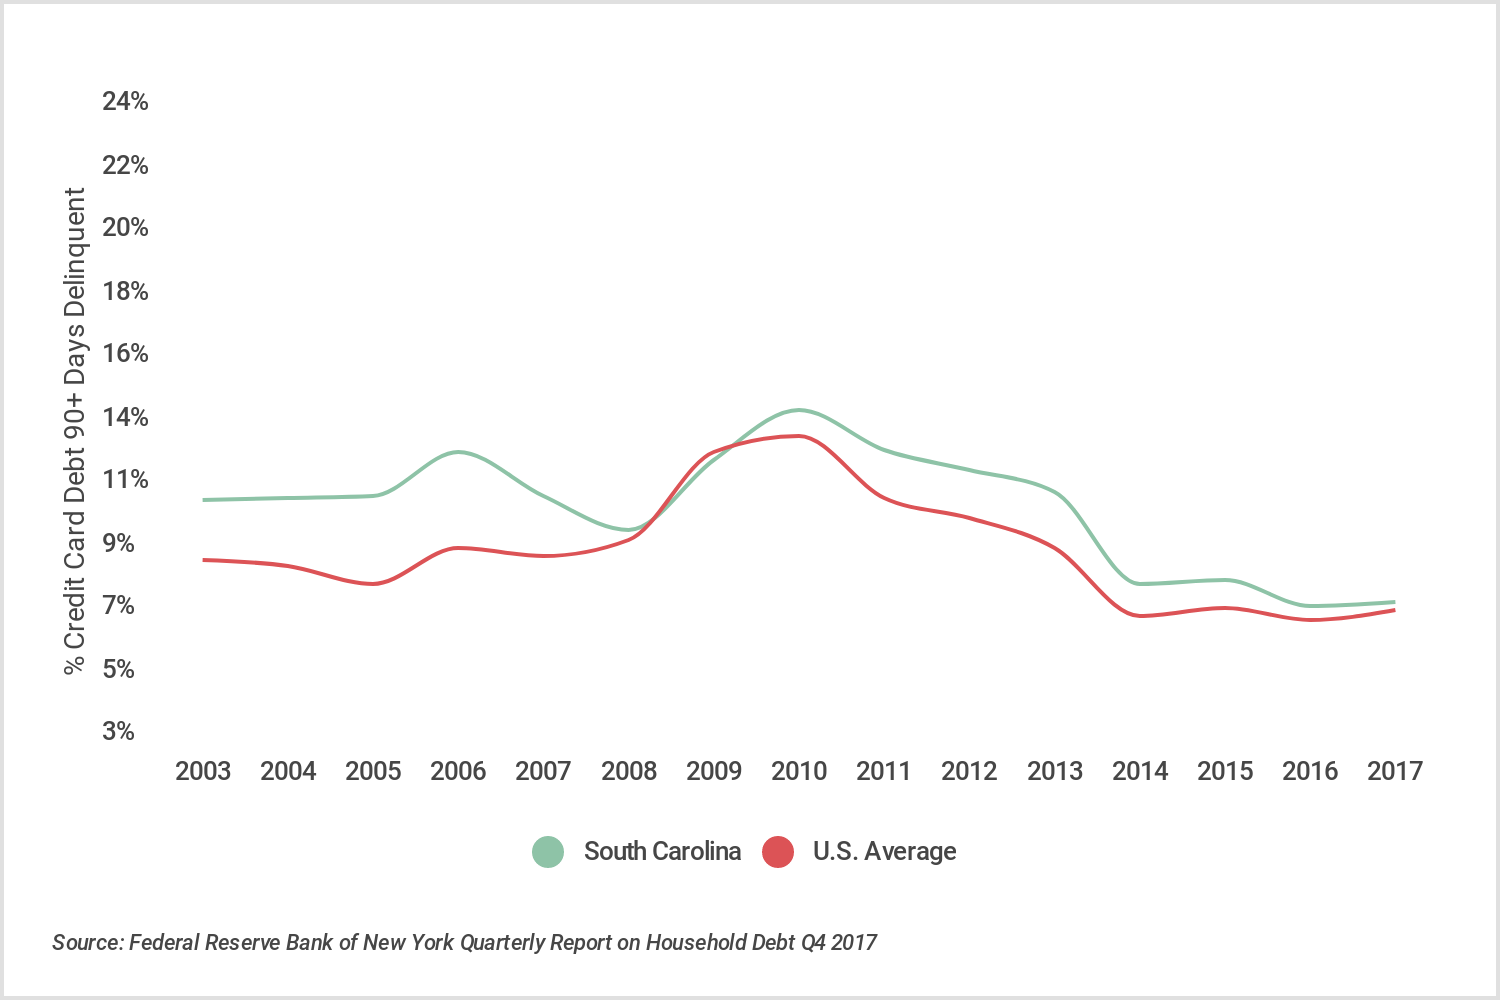
12. South Carolina
- Credit card delinquency rate: 7.80%
- Household credit card debt-to-income ratio: 12.08%
- Credit card debt per household: $5,978
- Median household income: $49,501
- Median credit score: 656
- Unemployment rate: 6.2%
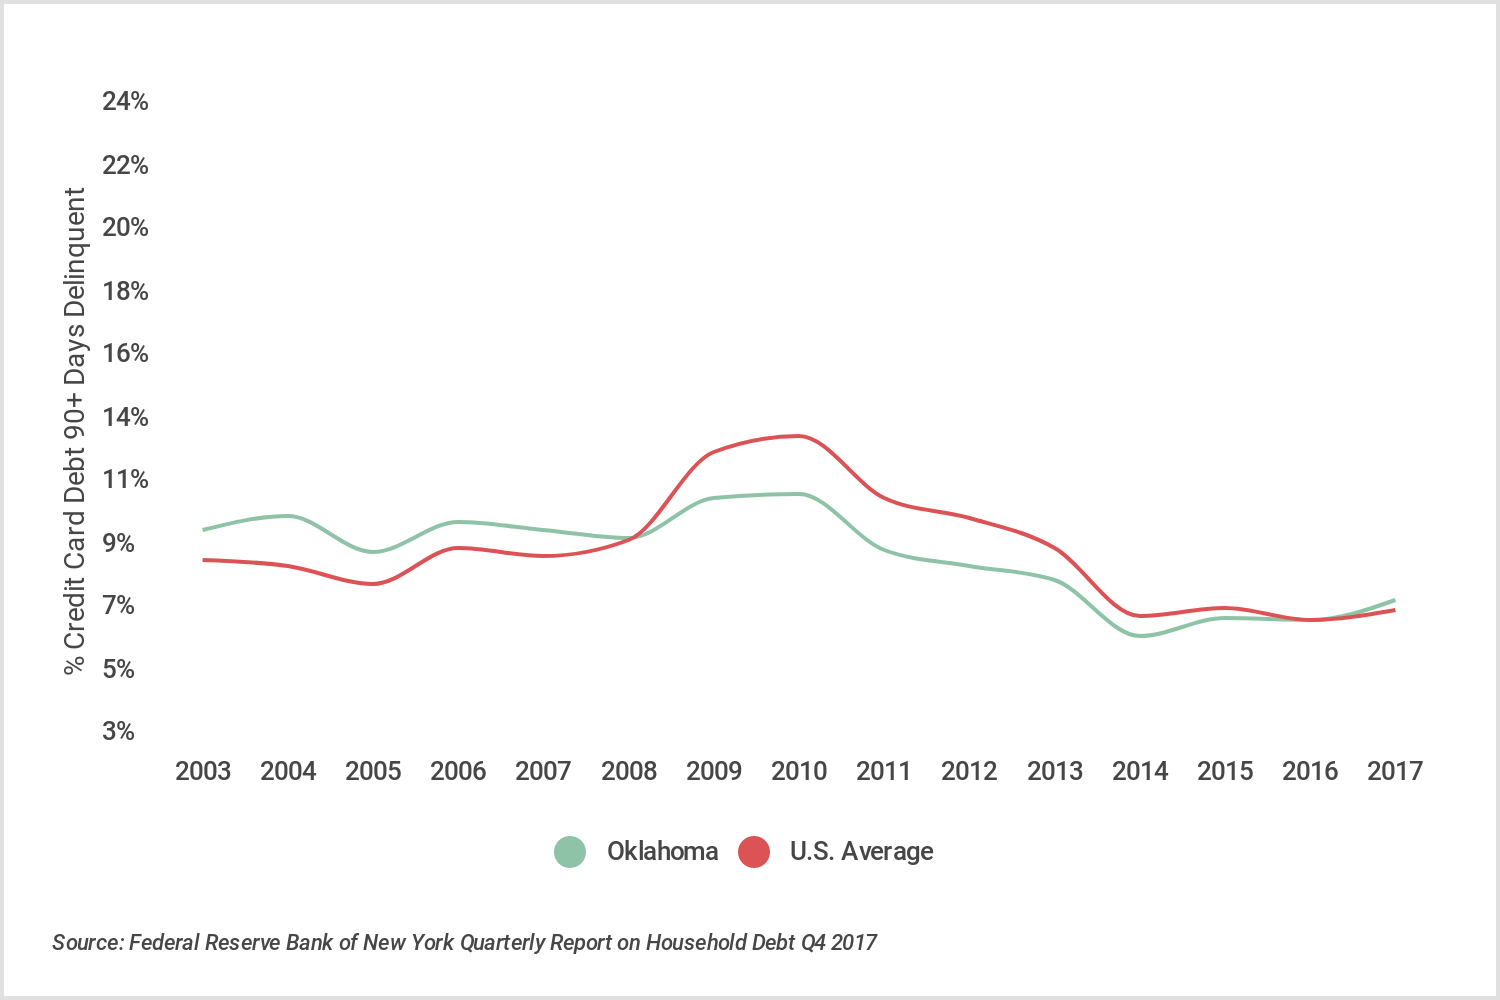
11. Oklahoma
- Credit card delinquency rate: 7.86%
- Household credit card debt-to-income ratio: 11.22%
- Credit card debt per household: $5,518
- Median household income: $49,176
- Median credit score: 659
- Unemployment rate: 3.7%
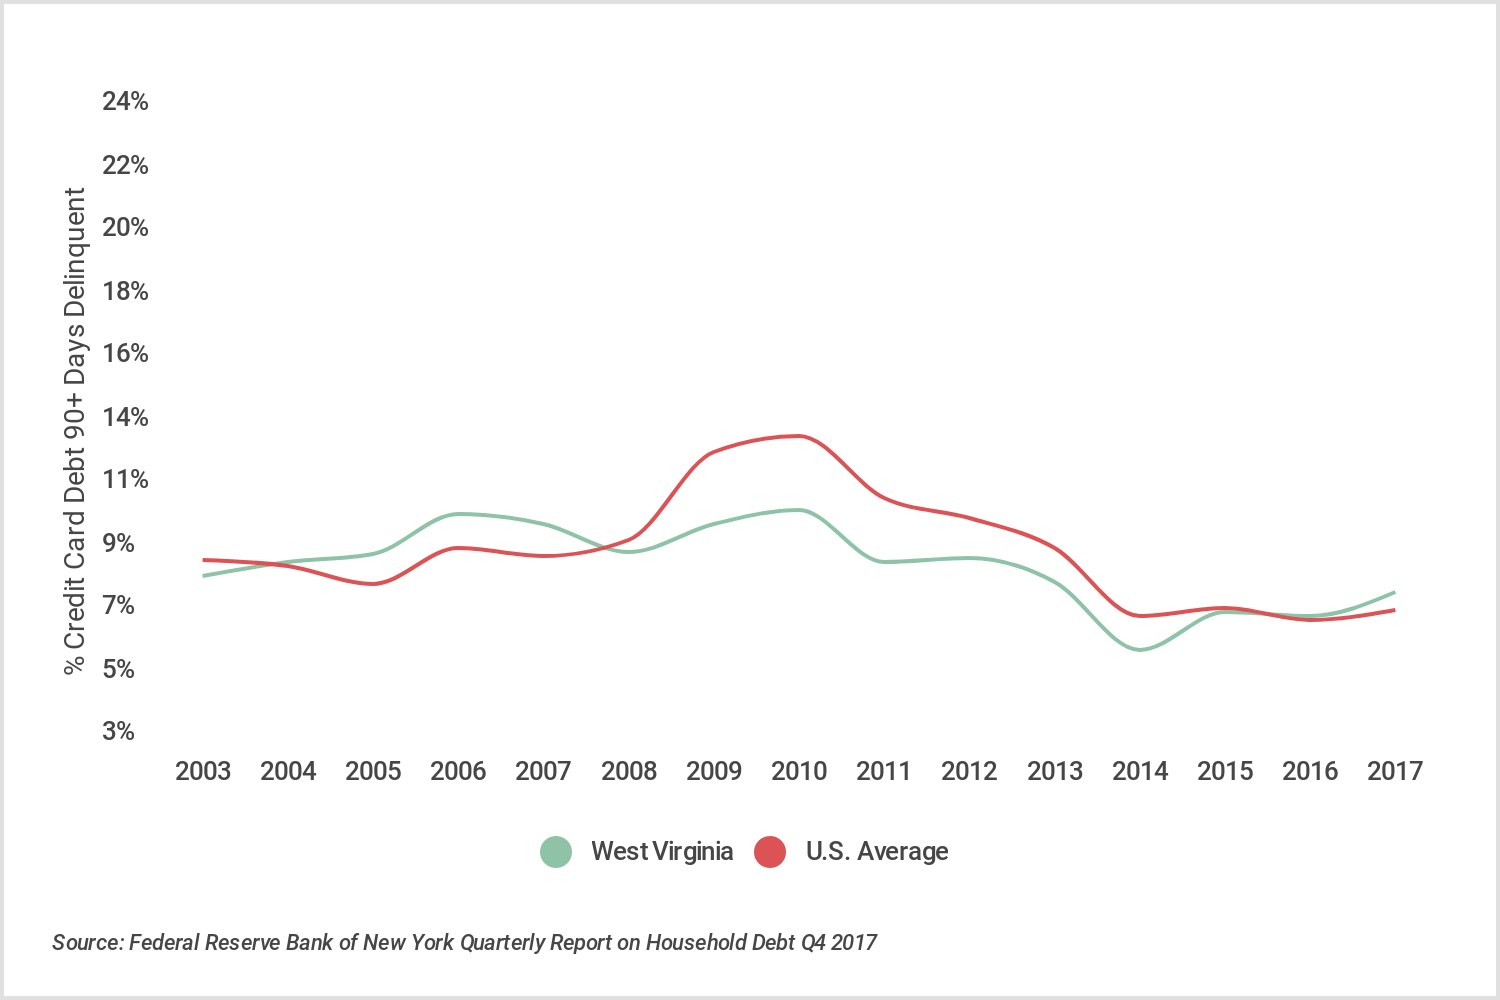
10. West Virginia
- Credit card delinquency rate: 8.11%
- Household credit card debt-to-income ratio: 11.30%
- Credit card debt per household: $4,903
- Median household income: $43,385
- Median credit score: 656
- Unemployment rate: 4.3%
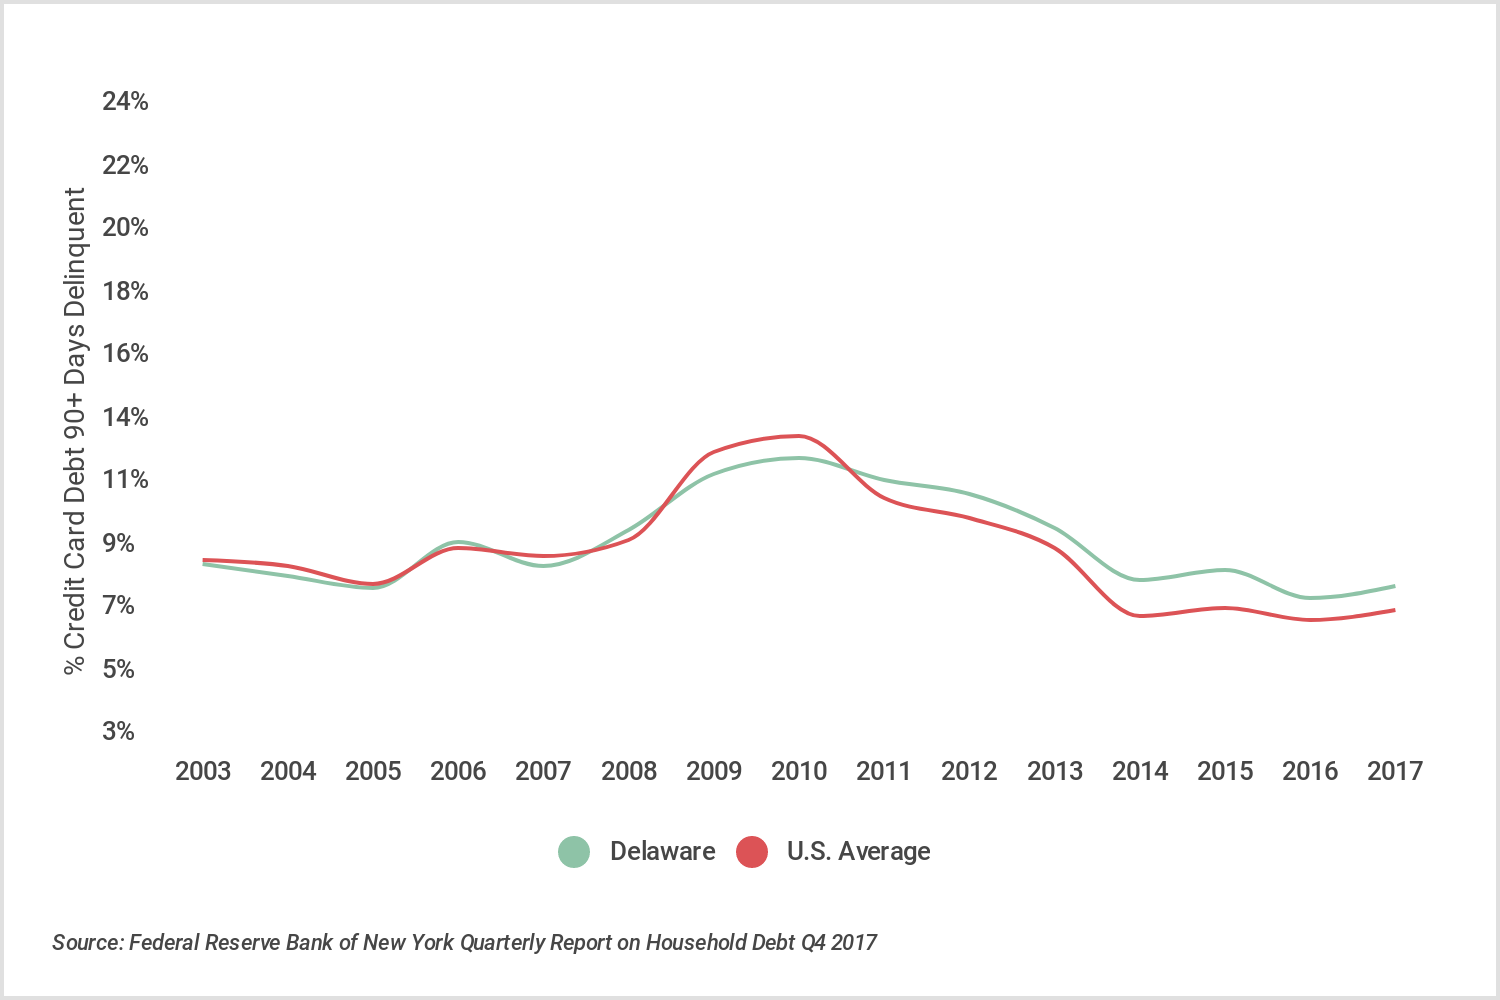
9. Delaware
- Credit card delinquency rate: 8.31%
- Household credit card debt-to-income ratio: 12.01%
- Credit card debt per household: $7,419
- Median household income: $61,757
- Median credit score: 677
- Unemployment rate: 4.8%
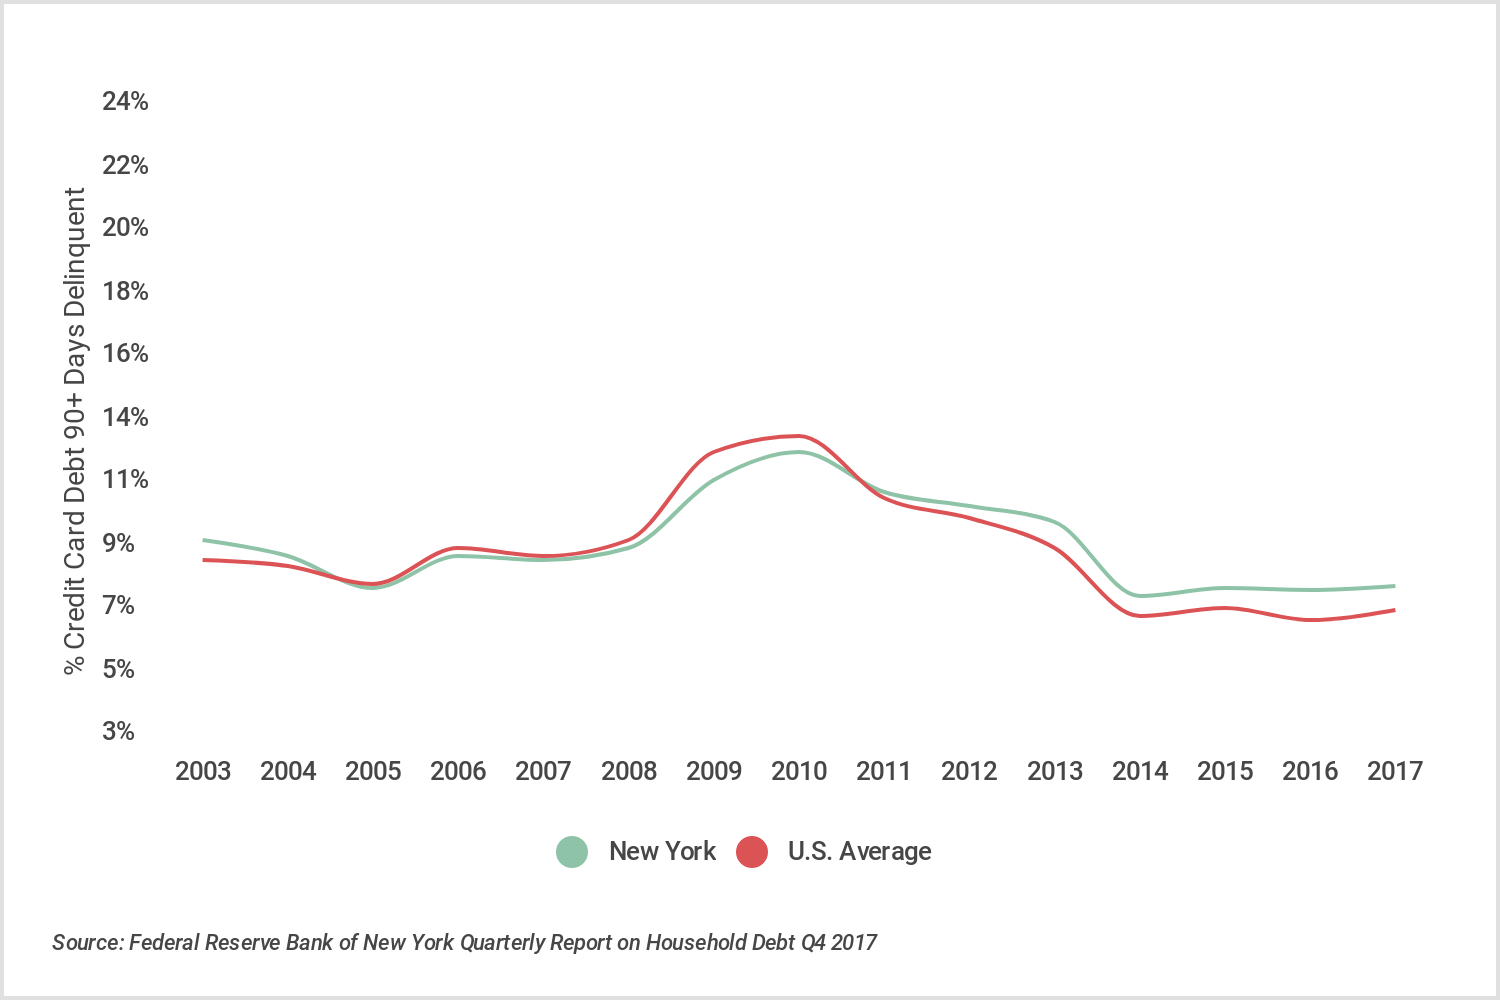
8. New York
- Credit card delinquency rate: 8.32%
- Household credit card debt-to-income ratio: 12.83%
- Credit card debt per household: $8,072
- Median household income: $62,909
- Median credit score: 684
- Unemployment rate: 4.7%
7. California
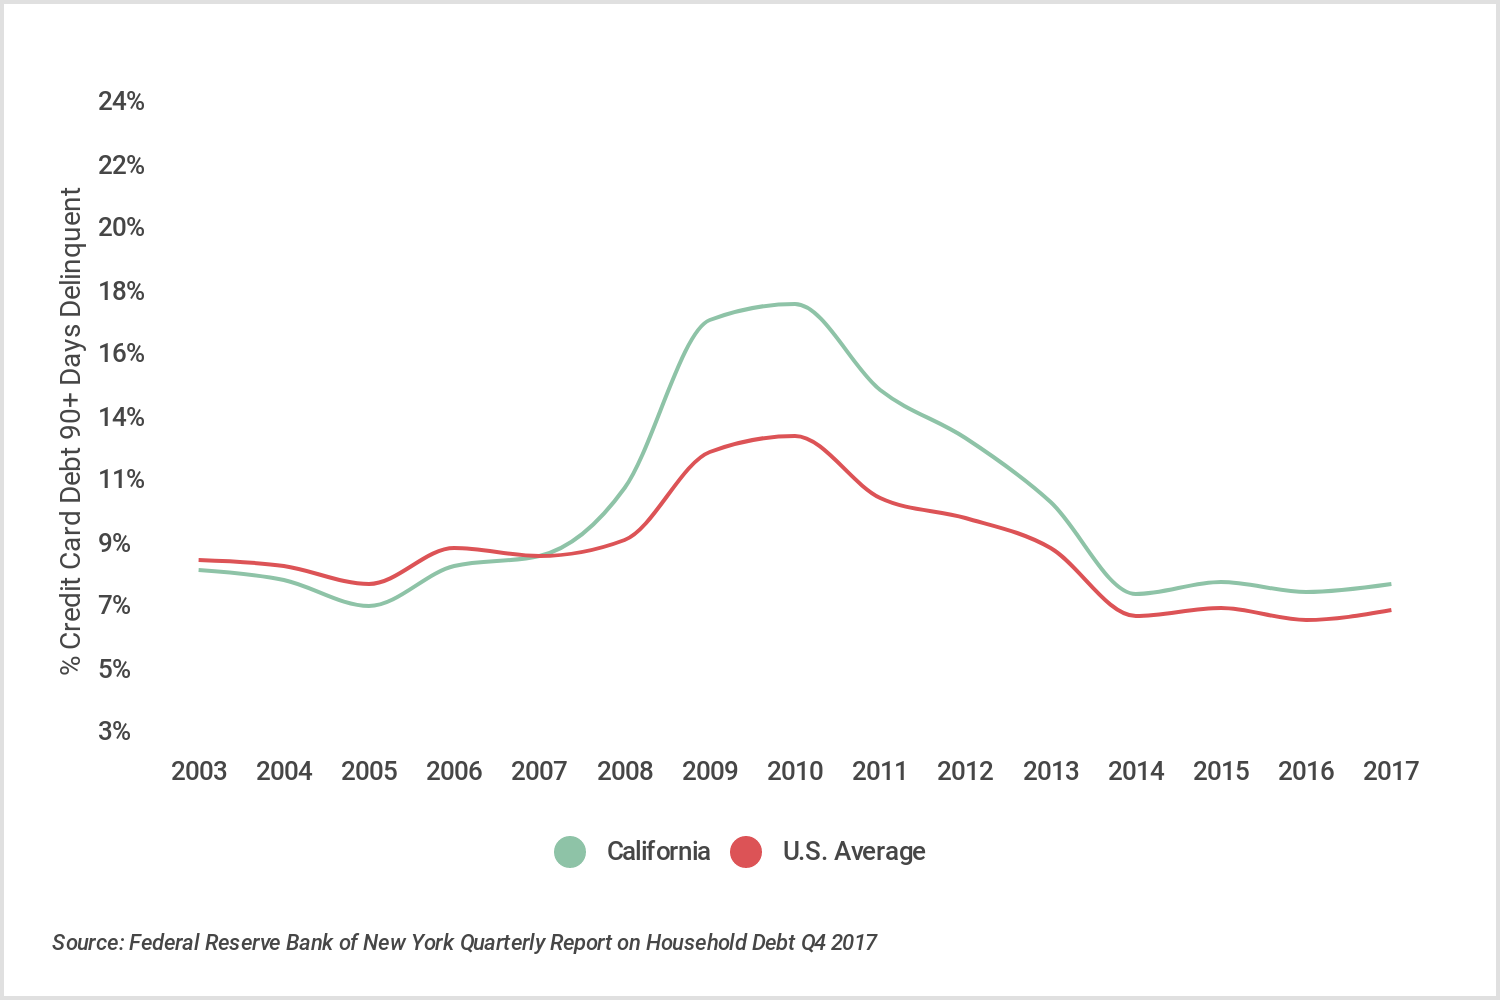
- Credit card delinquency rate: 8.37%
- Household credit card debt-to-income ratio: 12.18%
- Credit card debt per household: $8,251
- Median household income: $67,739
- Median credit score: 684
- Unemployment rate: 4.6%
6. Texas
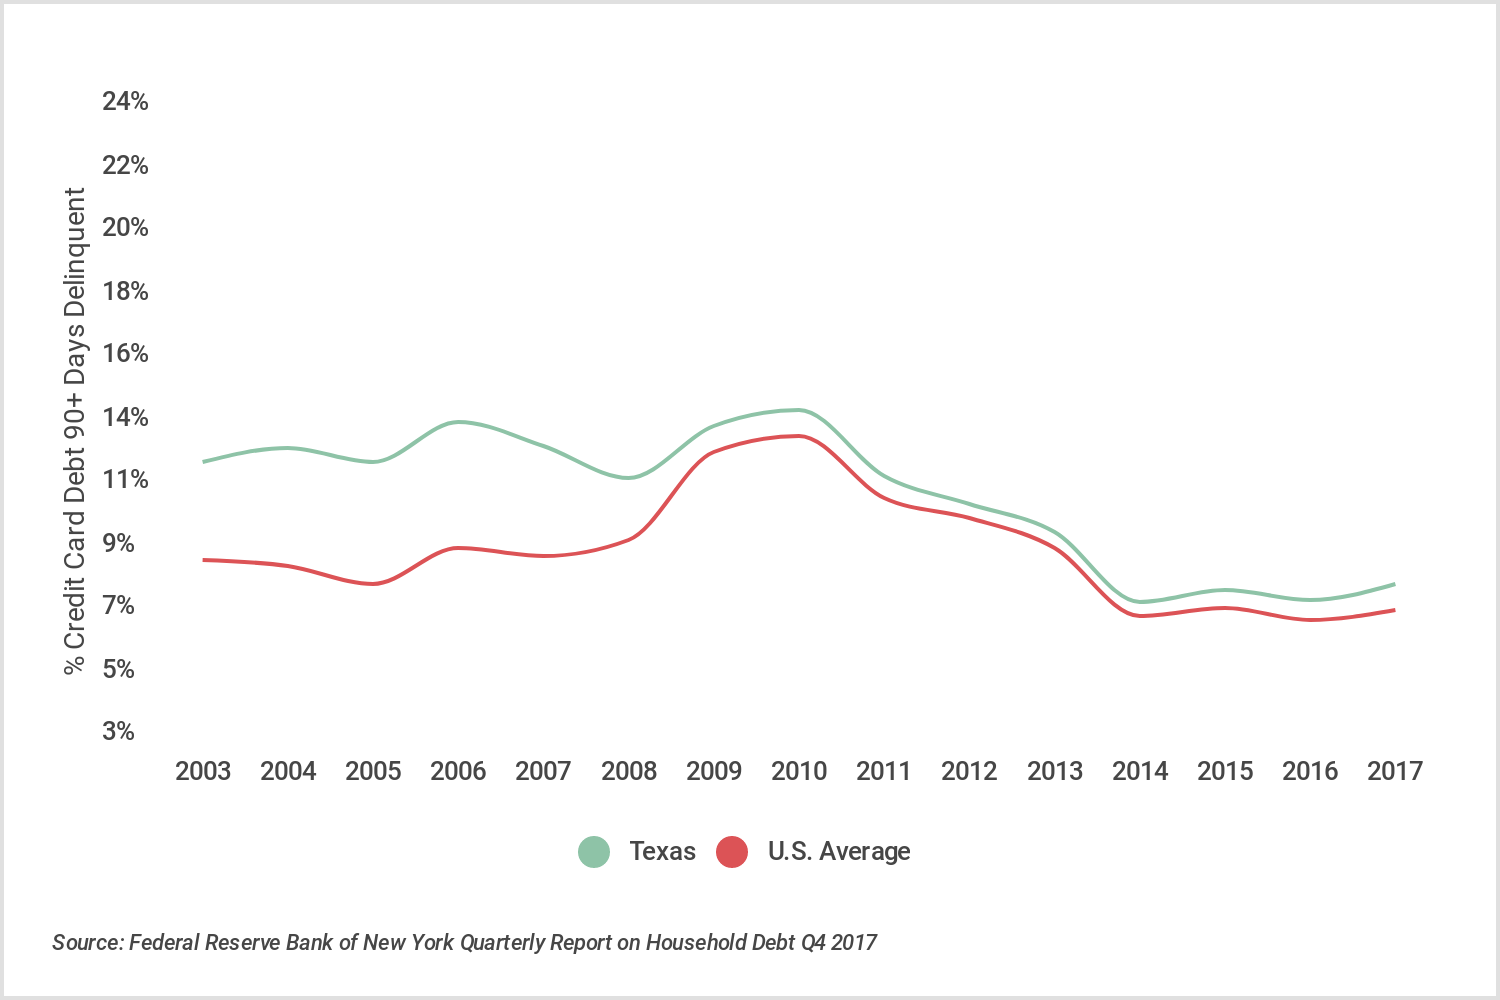
- Credit card delinquency rate: 8.41%
- Household credit card debt-to-income ratio: 12.49%
- Credit card debt per household: $7,063
- Median household income: $56,565
- Median credit score: 661
- Unemployment rate: 5.2%
5. Arkansas
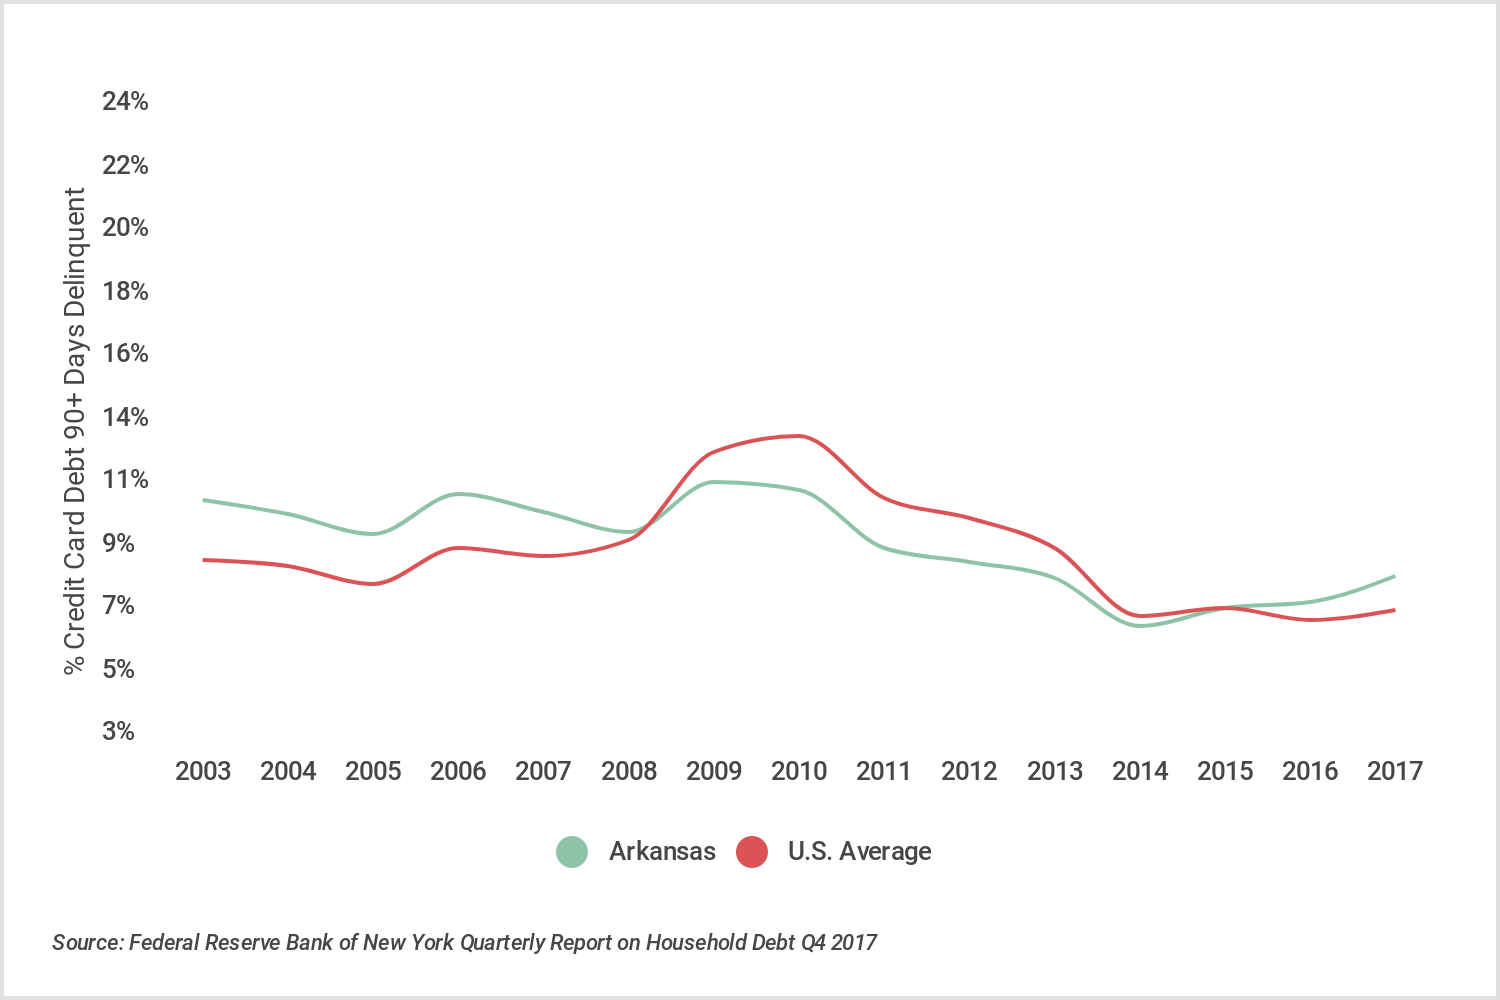
- Credit card delinquency rate: 8.66%
- Household credit card debt-to-income ratio: 10.83%
- Credit card debt per household: $4,801
- Median household income: $44,334
- Median credit score: 660
- Unemployment rate: 4.3%
4. New Mexico
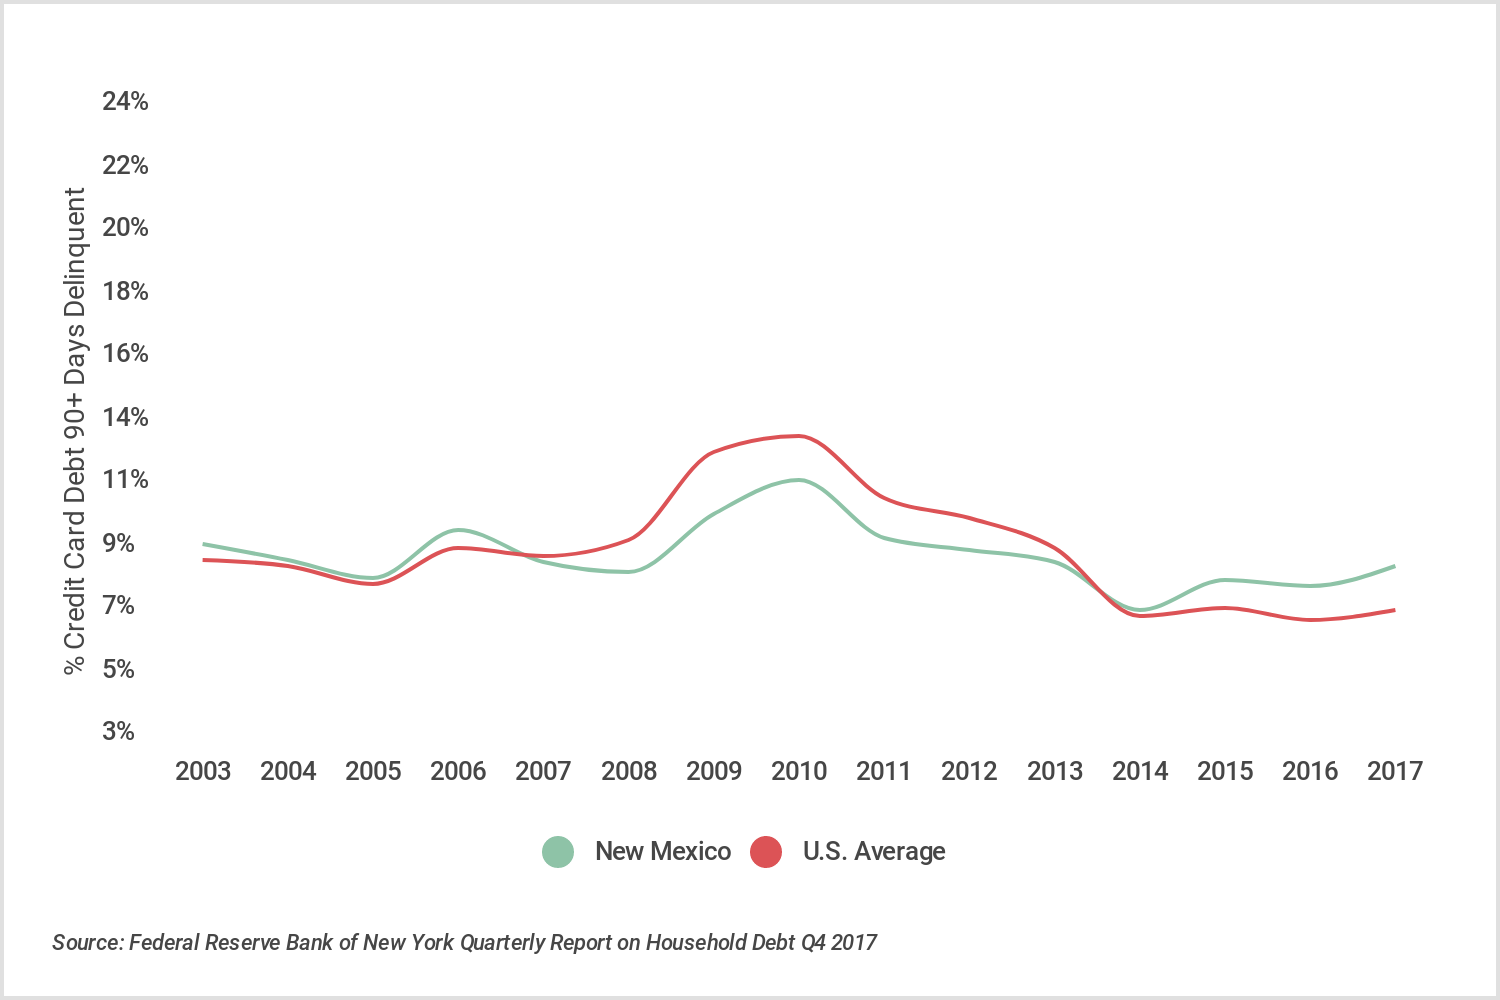
- Credit card delinquency rate: 9.02%
- Household credit card debt-to-income ratio: 12.47%
- Credit card debt per household: $5,831
- Median household income: $46,748
- Median credit score: 660
- Unemployment rate: 4.3%
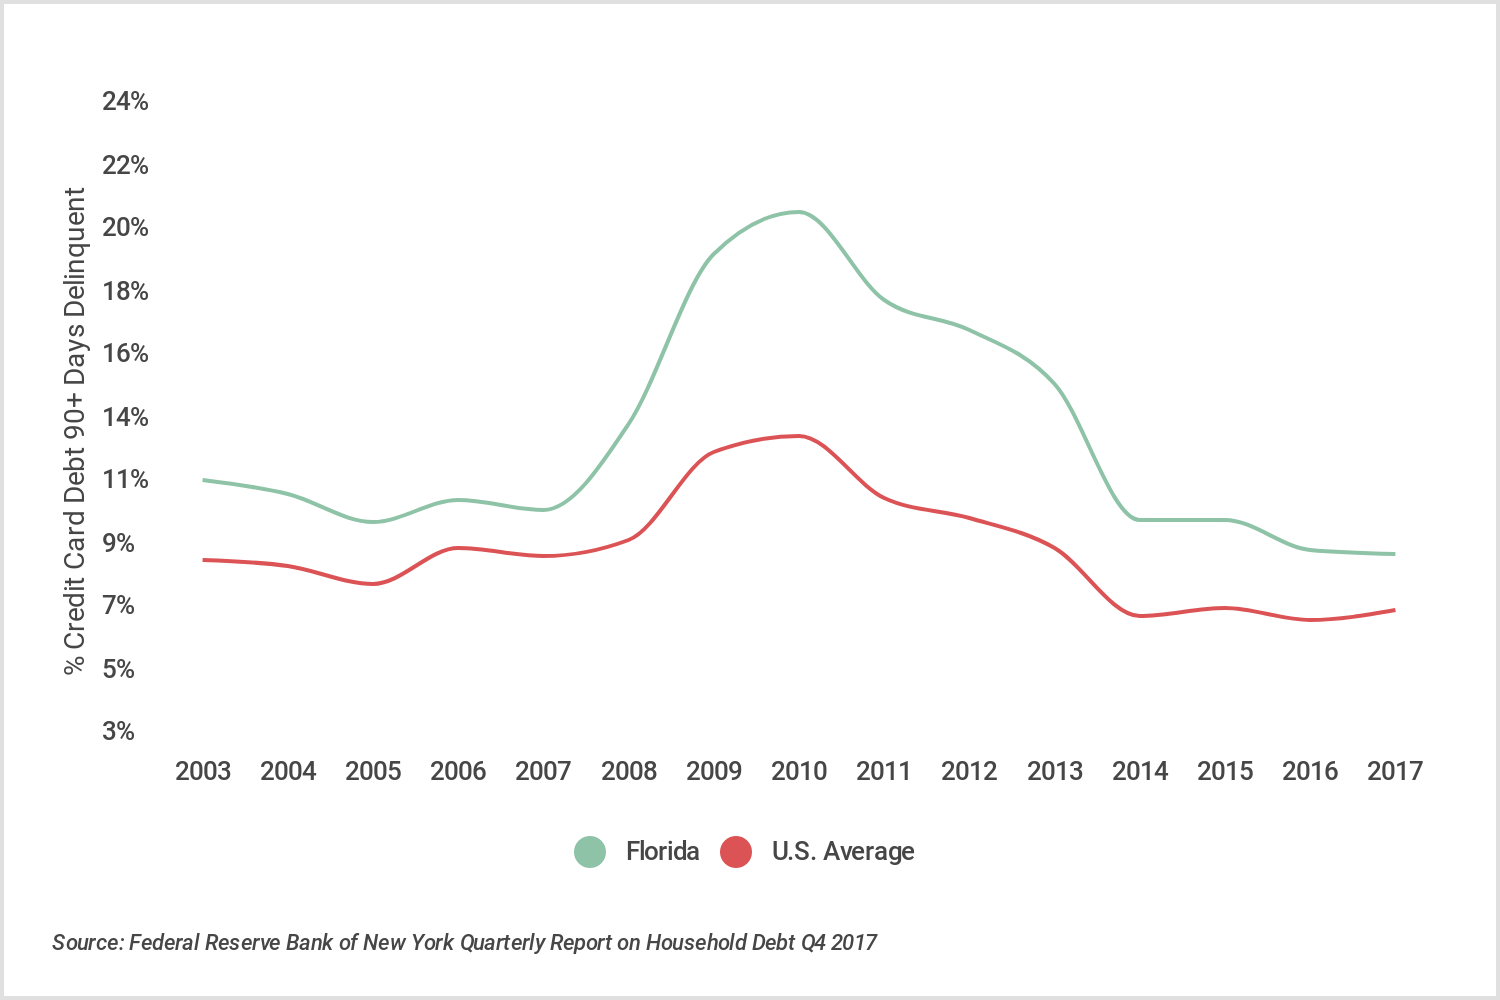
3. Florida
- Credit card delinquency rate: 9.41%
- Household credit card debt-to-income ratio: 15.37%
- Credit card debt per household: $7,819
- Median household income: $50,860
- Median credit score: 670
- Unemployment rate: 5.1%
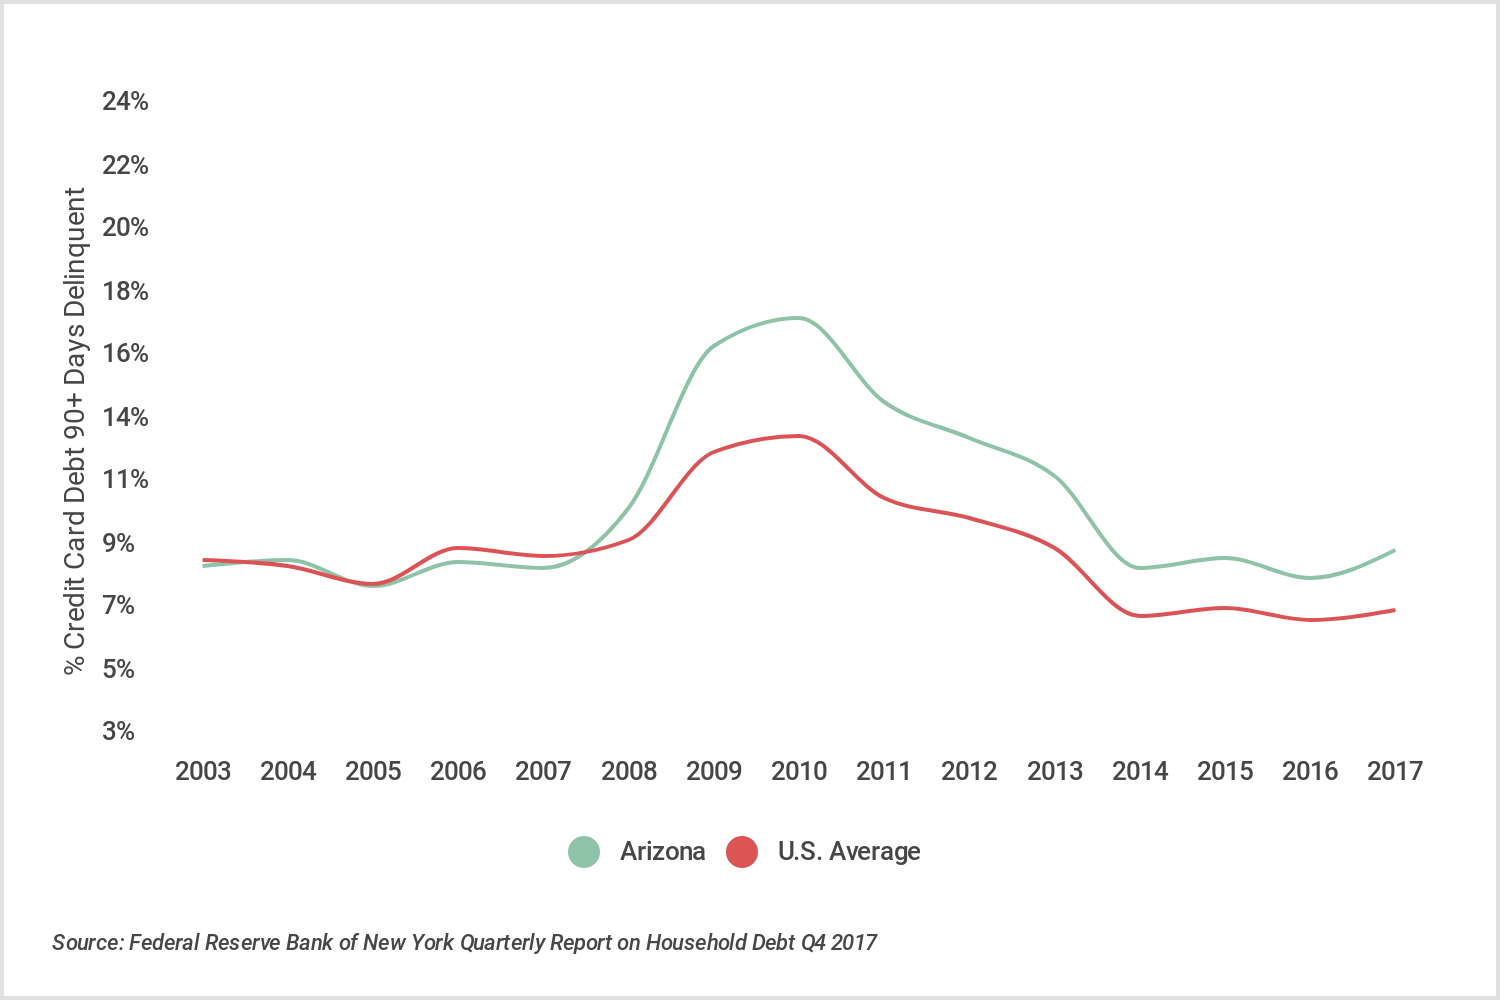
2. Arizona
- Credit card delinquency rate: 9.54%
- Household credit card debt-to-income ratio: 12.52%
- Credit card debt per household: $6,704
- Median household income: $53,558
- Median credit score: 667
- Unemployment rate: 4.4%
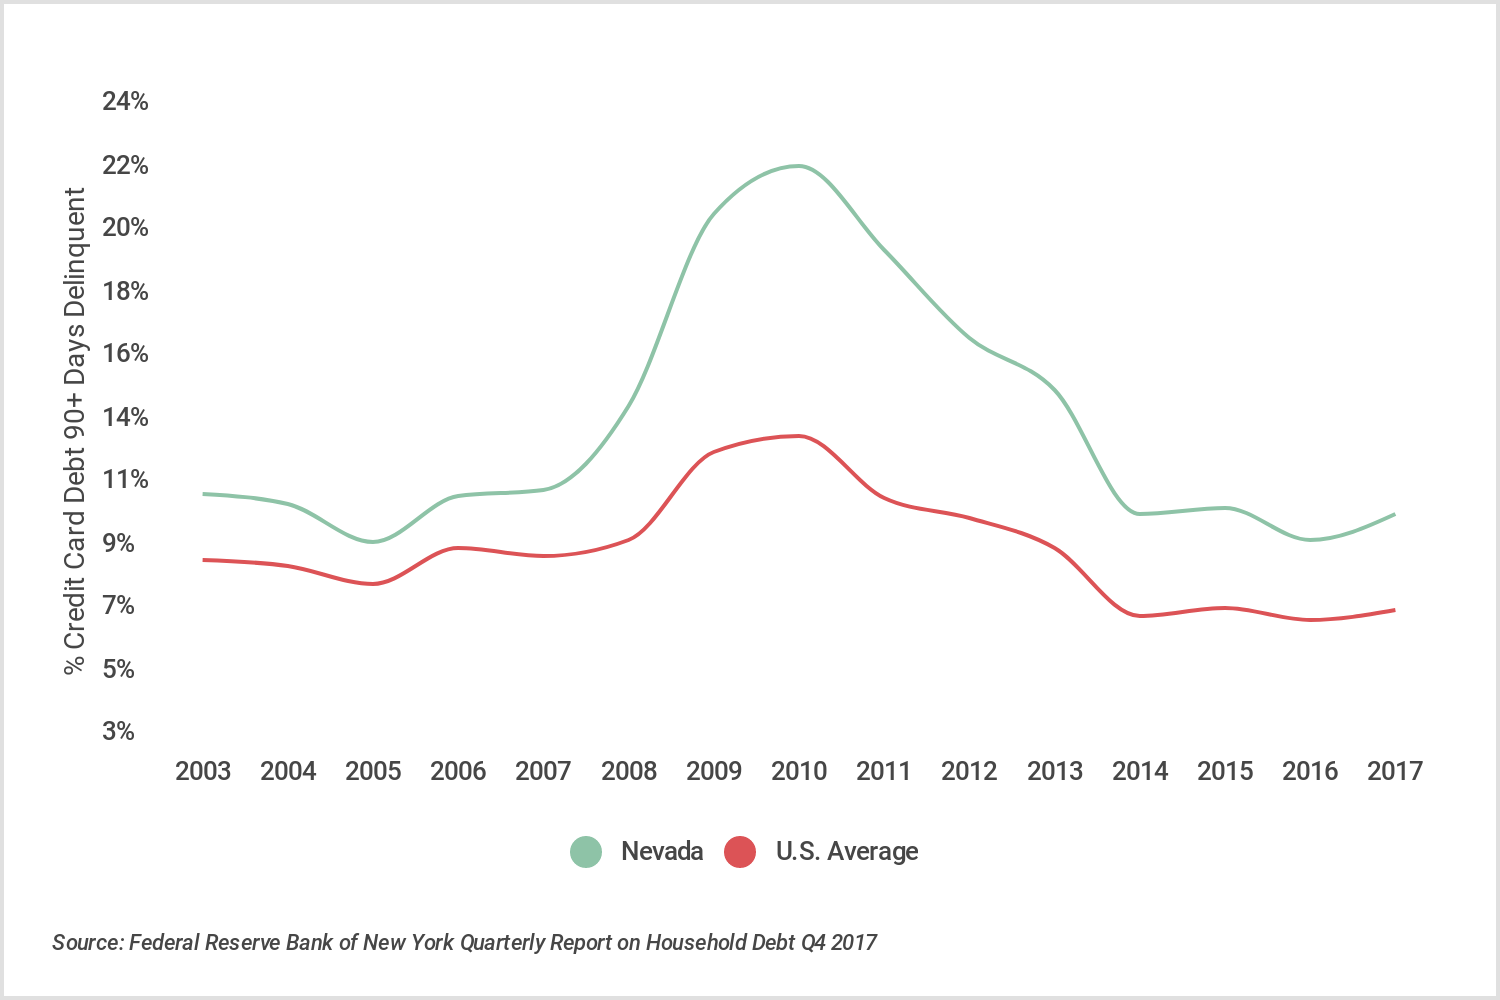
1. Nevada
- Credit card delinquency rate: 10.76%
- Household credit card debt-to-income ratio: 13.36%
- Credit card debt per household: $7,371
- Median household income: $55,180
- Median credit score: 654
- Unemployment rate: 4.70%
Methodology & full results
The state-level credit card debt statistics used in this analysis are from the Federal Reserve Bank of New York, Quarterly Report on Household Debt and Credit Q4 2017 (the most recent state-level data available). National credit card debt statistics are from the Q2 2018 report (the most recent national-level data available).
For each state, Credit card debt per household was calculated by dividing the total credit card debt for that state (New York Fed) by its total number of households (U.S. Census Bureau, 2016 American Community Survey 5-year Estimates). The resulting statistic was divided by median household income (also from the U.S. Census Bureau, 2016 ACS) to determine the debt-to-income ratio.
The Median credit score for each state was sourced from Credit Sesame’s Credit Score Survey from January 2018. The Unemployment rates shown are 2017 averages from the U.S. Bureau of Labor Statistics, Local Area Unemployment Statistics.
The final list of states is ordered by Credit card delinquency rate, which is the percent of credit card balances 90+ days delinquent.
More From Fox Sports 1510


